Beer, Student, and t-Distribution
By Helen Wong 王思齊

Does project-based learning improve students’ academic performance? Which candidate is more likely to win in an election? Is a new drug effective in treating a certain disease?
While these scenarios may seem unrelated, they all share a common thread: We need to collect information from samples or to make an inference about a population, whether it’s all students, all voters, or all patients. This process is formally known as statistical inference. Assuming the sampling process is random and unbiased, the quantities calculated from these samples, such as sample mean or sample variance, will vary from one sample to another.
Thus, sample means obtained from different rounds of sampling follow a specific distribution. Without going into the rigorous mathematical proof, the central limit theorem tells us that the sampling distribution of the sample mean will be approximately normally distributed when the sample size is sufficiently large, even if the underlying population is not normally distributed.
But what happens when our sample size is small and we have no idea about the population standard deviation? Today, we take for granted that in such cases, given that the underlying population is a normal distribution, the sampling distribution of sample mean follows the Student’s t-distribution, thanks to a brewer named William Sealy Gosset (1876–1937) [1–3].
Born in Canterbury, England, Gosset was educated at the University of Oxford, where he earned a first-class degree in chemistry in 1899. Around this time, the Guinness brewery in Dublin recognized the need for rigorous quality control in beer production and began recruiting graduates from Oxford and Cambridge for this purpose. Gosset was among those selected.
As an apprentice brewer, Gosset needed to evaluate how the quality of barley and hops might affect that of the beer. The quality of agricultural products is known to vary throughout a year, depending on factors such as climate and soil conditions. Therefore, Gosset’s goal was to maintain a consistently high quality of beer while also ensuring cost-effectiveness. This necessitated relying on small samples to draw conclusions that could inform the large-scale brewing process.
By the early 20th century, the central limit theorem had been established, and many were familiar with using the normal distribution for statistical inference with large sample sizes. Gosset conducted experiments by sampling acidity values from beers produced under various conditions, such as using different batches of malted barley, to determine whether there were significant differences in mean acidity between these groups.
Through his calculations, Gosset discovered that when the sample size was small, the sampling distribution of the sample mean deviated noticeably from the normal distribution. This finding prompted his quest for a new distribution that would resemble the normal distribution but suitable for small sample observations.
Despite achieving a first in the mathematical moderations examination during his time at Oxford, Gosset was clearly not a professional mathematician. The creation of the Student’s t-distribution was closely tied to his extensive correspondence with many of the leading statisticians of his time.
Karl Pearson (footnote 1) was one of the key influences on Gosset’s career. Pearson introduced Gosset to nearly all the statistical methods known at the time and invited Gosset to visit his department at University College London from 1906 to 1907. During this period, Gosset worked on his small-sample problem and published the landmark paper “The Probable Error of a Mean” in the journal Biometrika [4], where Pearson served as editor, in 1908.
Some curious readers may have noticed that the author of the paper is credited as “Student” rather than William Sealy Gosset. This was due to a policy at the Guinness brewery that prohibited staff from publishing under their own names or using any company data. To comply with this policy, Gosset adopted the pen name “Student,” which is believed to have been inspired by the cover of a notebook he was using at the time – The Student’s Science Notebook [5].
Yet Gosset himself did not coin the term “t-distribution.” In his 1908 paper, he still used the symbol z in his derivation of the sampling distribution of the sample mean for sample sizes ranging from 4 to 10. The symbol t was later introduced by Ronald Fisher (footnote 2), a legendary statistician and close friend of Gosset, in a 1925 paper [6]. In this work, Fisher fully derived the values of the Student’s t-distribution and demonstrated that it is a transformed normal distribution. The shape of the t-distribution changes depending on the sample size n, which is represented by the degrees of freedom (calculated as n – 1). With a smaller number of observations, the t-distribution is flatter at the peak and has “thicker” tails compared to the normal distribution (figure 1). As the sample size increases, especially when n exceeds 30, the t-distribution starts to resemble the normal distribution.
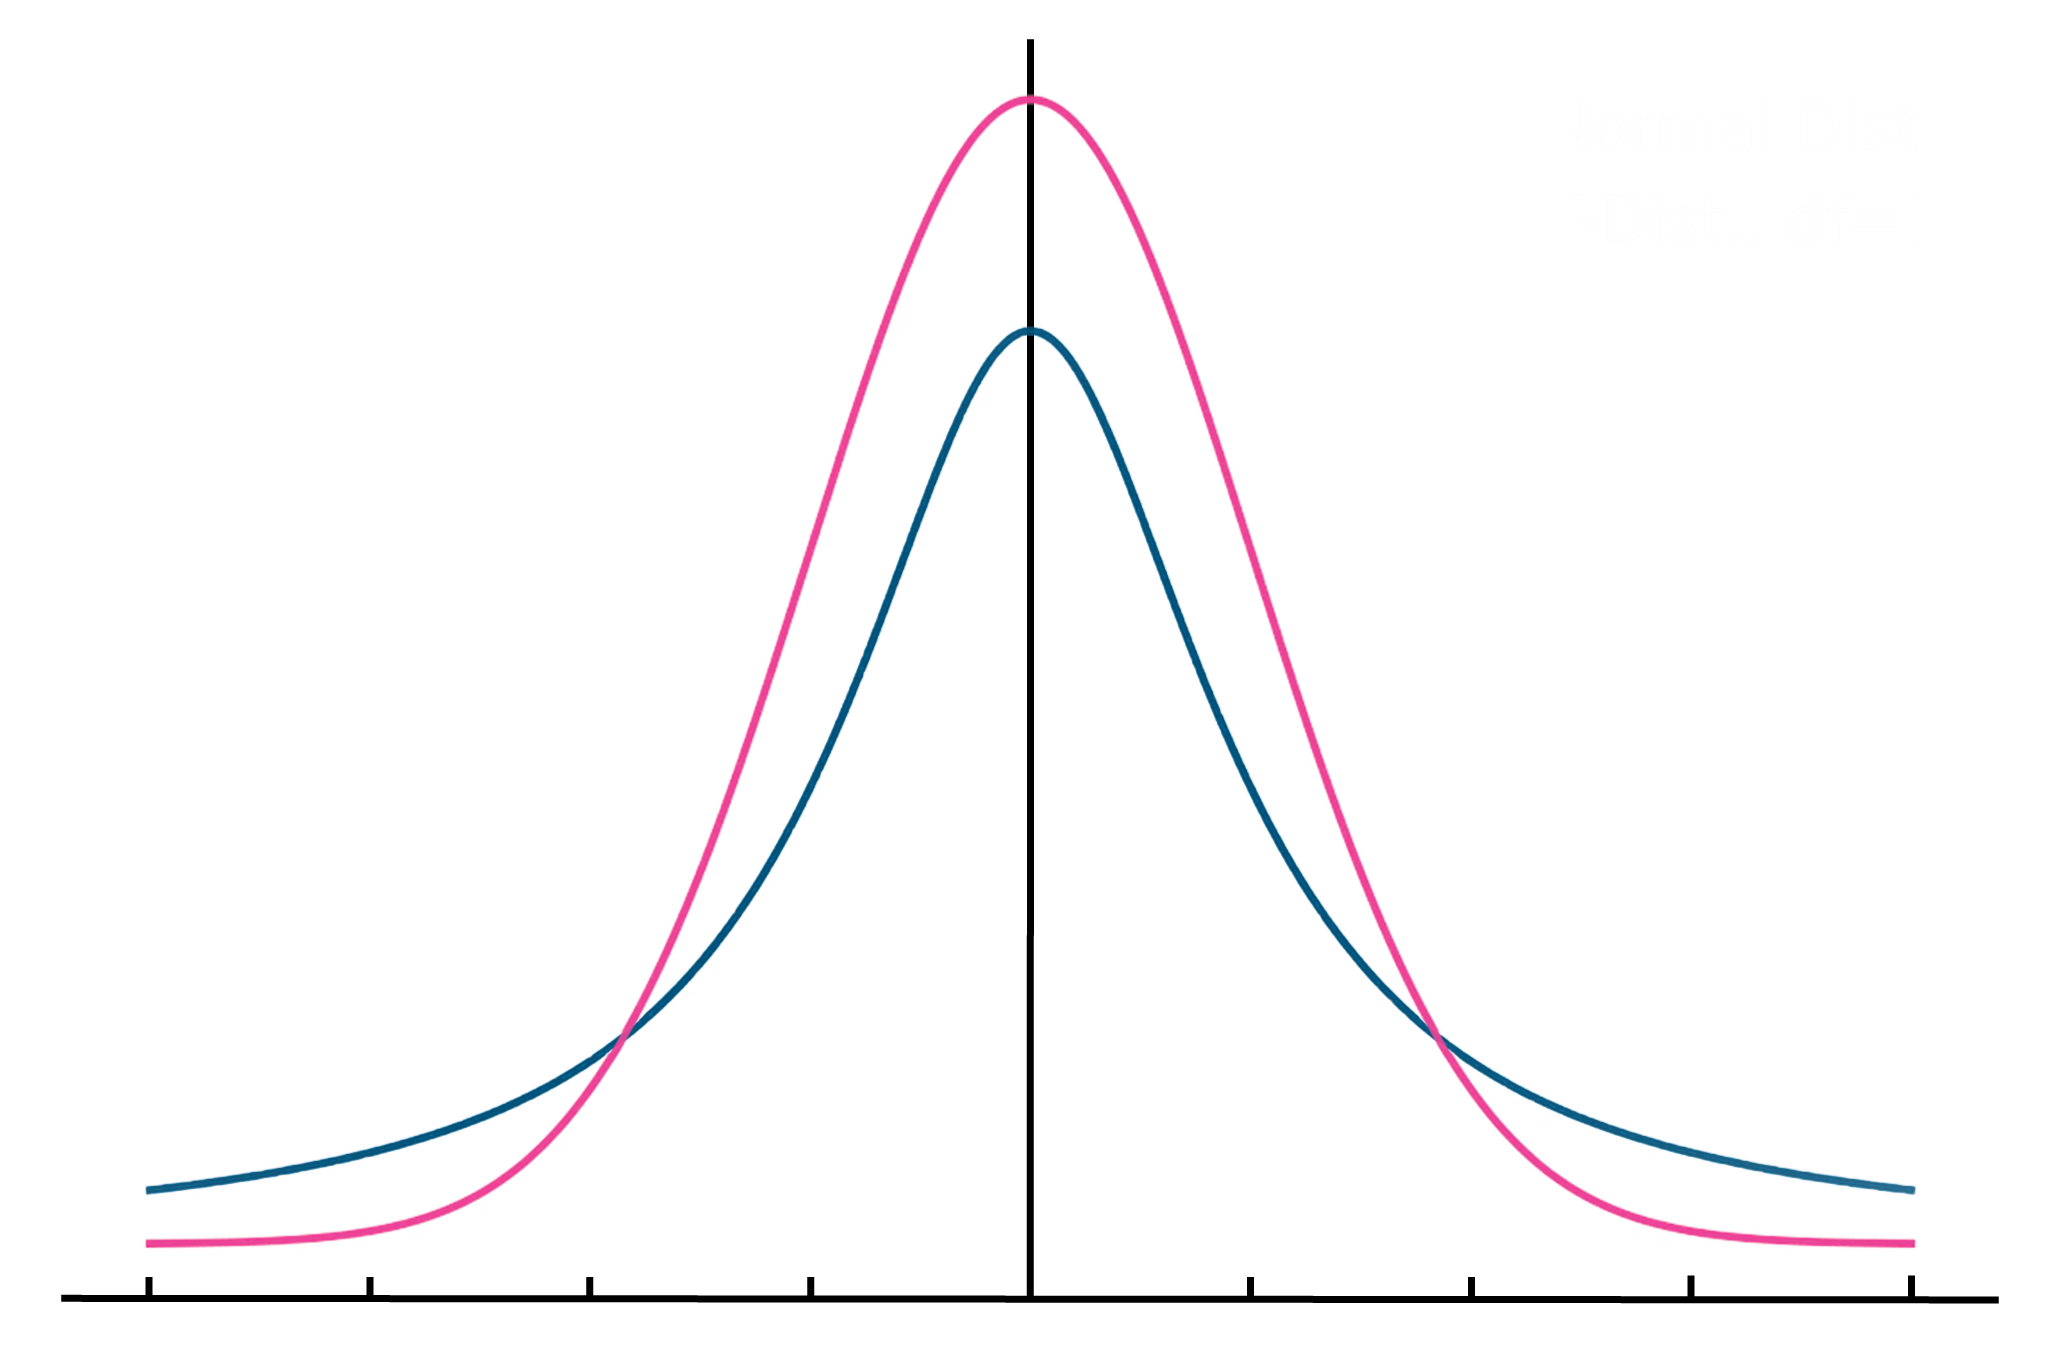
Figure 1 Normal distribution (pink) and t-distribution when the degree of freedom is 1 (blue). The t-distribution is flatter at the peak and has “thicker” tails compared to the normal distribution.
Perhaps contrary to Gosset’s expectations, as reflected in his letter to Fisher, “you’re the only man that’s ever likely to use them!” the t-distribution has become one of the most famous statistical distributions. It is widely applied in both everyday life and academic research, and of course, a staple in statistics courses. So, the next time you encounter the Student’s t-distribution (or find yourself grappling with it in class), take a moment to appreciate the “Student” behind it, William Sealy Gosset, and the fascinating story of its creation.
Footnotes
Karl Pearson (1857–1936) was a British statistician and a key figure in the development of modern statistics [7]. His work laid the foundation for many statistical methods and concepts still in use today, including the Pearson correlation coefficient and the chi-squared distribution. Notably, Pearson founded the first university statistics department in the world at University College London in 1911.
- Ronald Aylmer Fisher (1890–1962) was a British statistician and geneticist [8]. Hailed as “a genius who almost single-handedly created the foundations of modern statistical science,” Fisher’s contributions to statistics include the significance test, analysis of variance (ANOVA), and maximum likelihood estimation, among many others. In genetics, he is regarded as one of the three founding fathers of population genetics, a key component of the modern synthesis that combines Mendelian genetics with Darwin’s theory of evolution.
References
[1] Brown, A. (2008). The strange origins of the Student’s t-test. Physiology News, Summer 2008, 13–16. https://doi.org/10.36866/pn.71.13
[2] Pearson, E. S., Gosset, W. S., Plackett, R. L., & Barnard, G. A. (1990). Student: A statistical biography of William Sealy Gosset. Clarendon Press; Oxford University Press.
[3] Trkulja, V., & Hrabač, P. (2020). The role of t test in beer brewing. Croatian Medical Journal, 61(1), 69–72. https://doi.org/10.3325/cmj.2020.61.69
[4] Student. (1908). The Probable Error of a Mean. Biometrika, 6(1), 1. https://doi.org/10.2307/2331554
[5] Ziliak, S. T. (2008). Retrospectives: Guinnessometrics: The Economic Foundation of “Student’s” t. Journal of Economic Perspectives, 22(4), 199–216. https://doi.org/10.1257/jep.22.4.199
[6] Fisher, R. A. (1925). Applications of Student’s distribution. Metron, 5, 90–104.
[7] Magnello, M. E. (2014). Pearson, Karl: His Life and Contribution to Statistics. In Wiley StatsRef: Statistics Reference Online. John Wiley & Sons, Ltd. https://doi.org/10.1002/9781118445112.stat04822
[8] UCL. (2021, March 2). Ronald Aylmer Fisher (1890-1962). https://www.ucl.ac.uk/biosciences/gee/ucl-centre-computational-biology/ronald-aylmer-fisher-1890-1962